point source delta
Sara Morón
Software Used:
- Badlands 1.0
Model Setup:
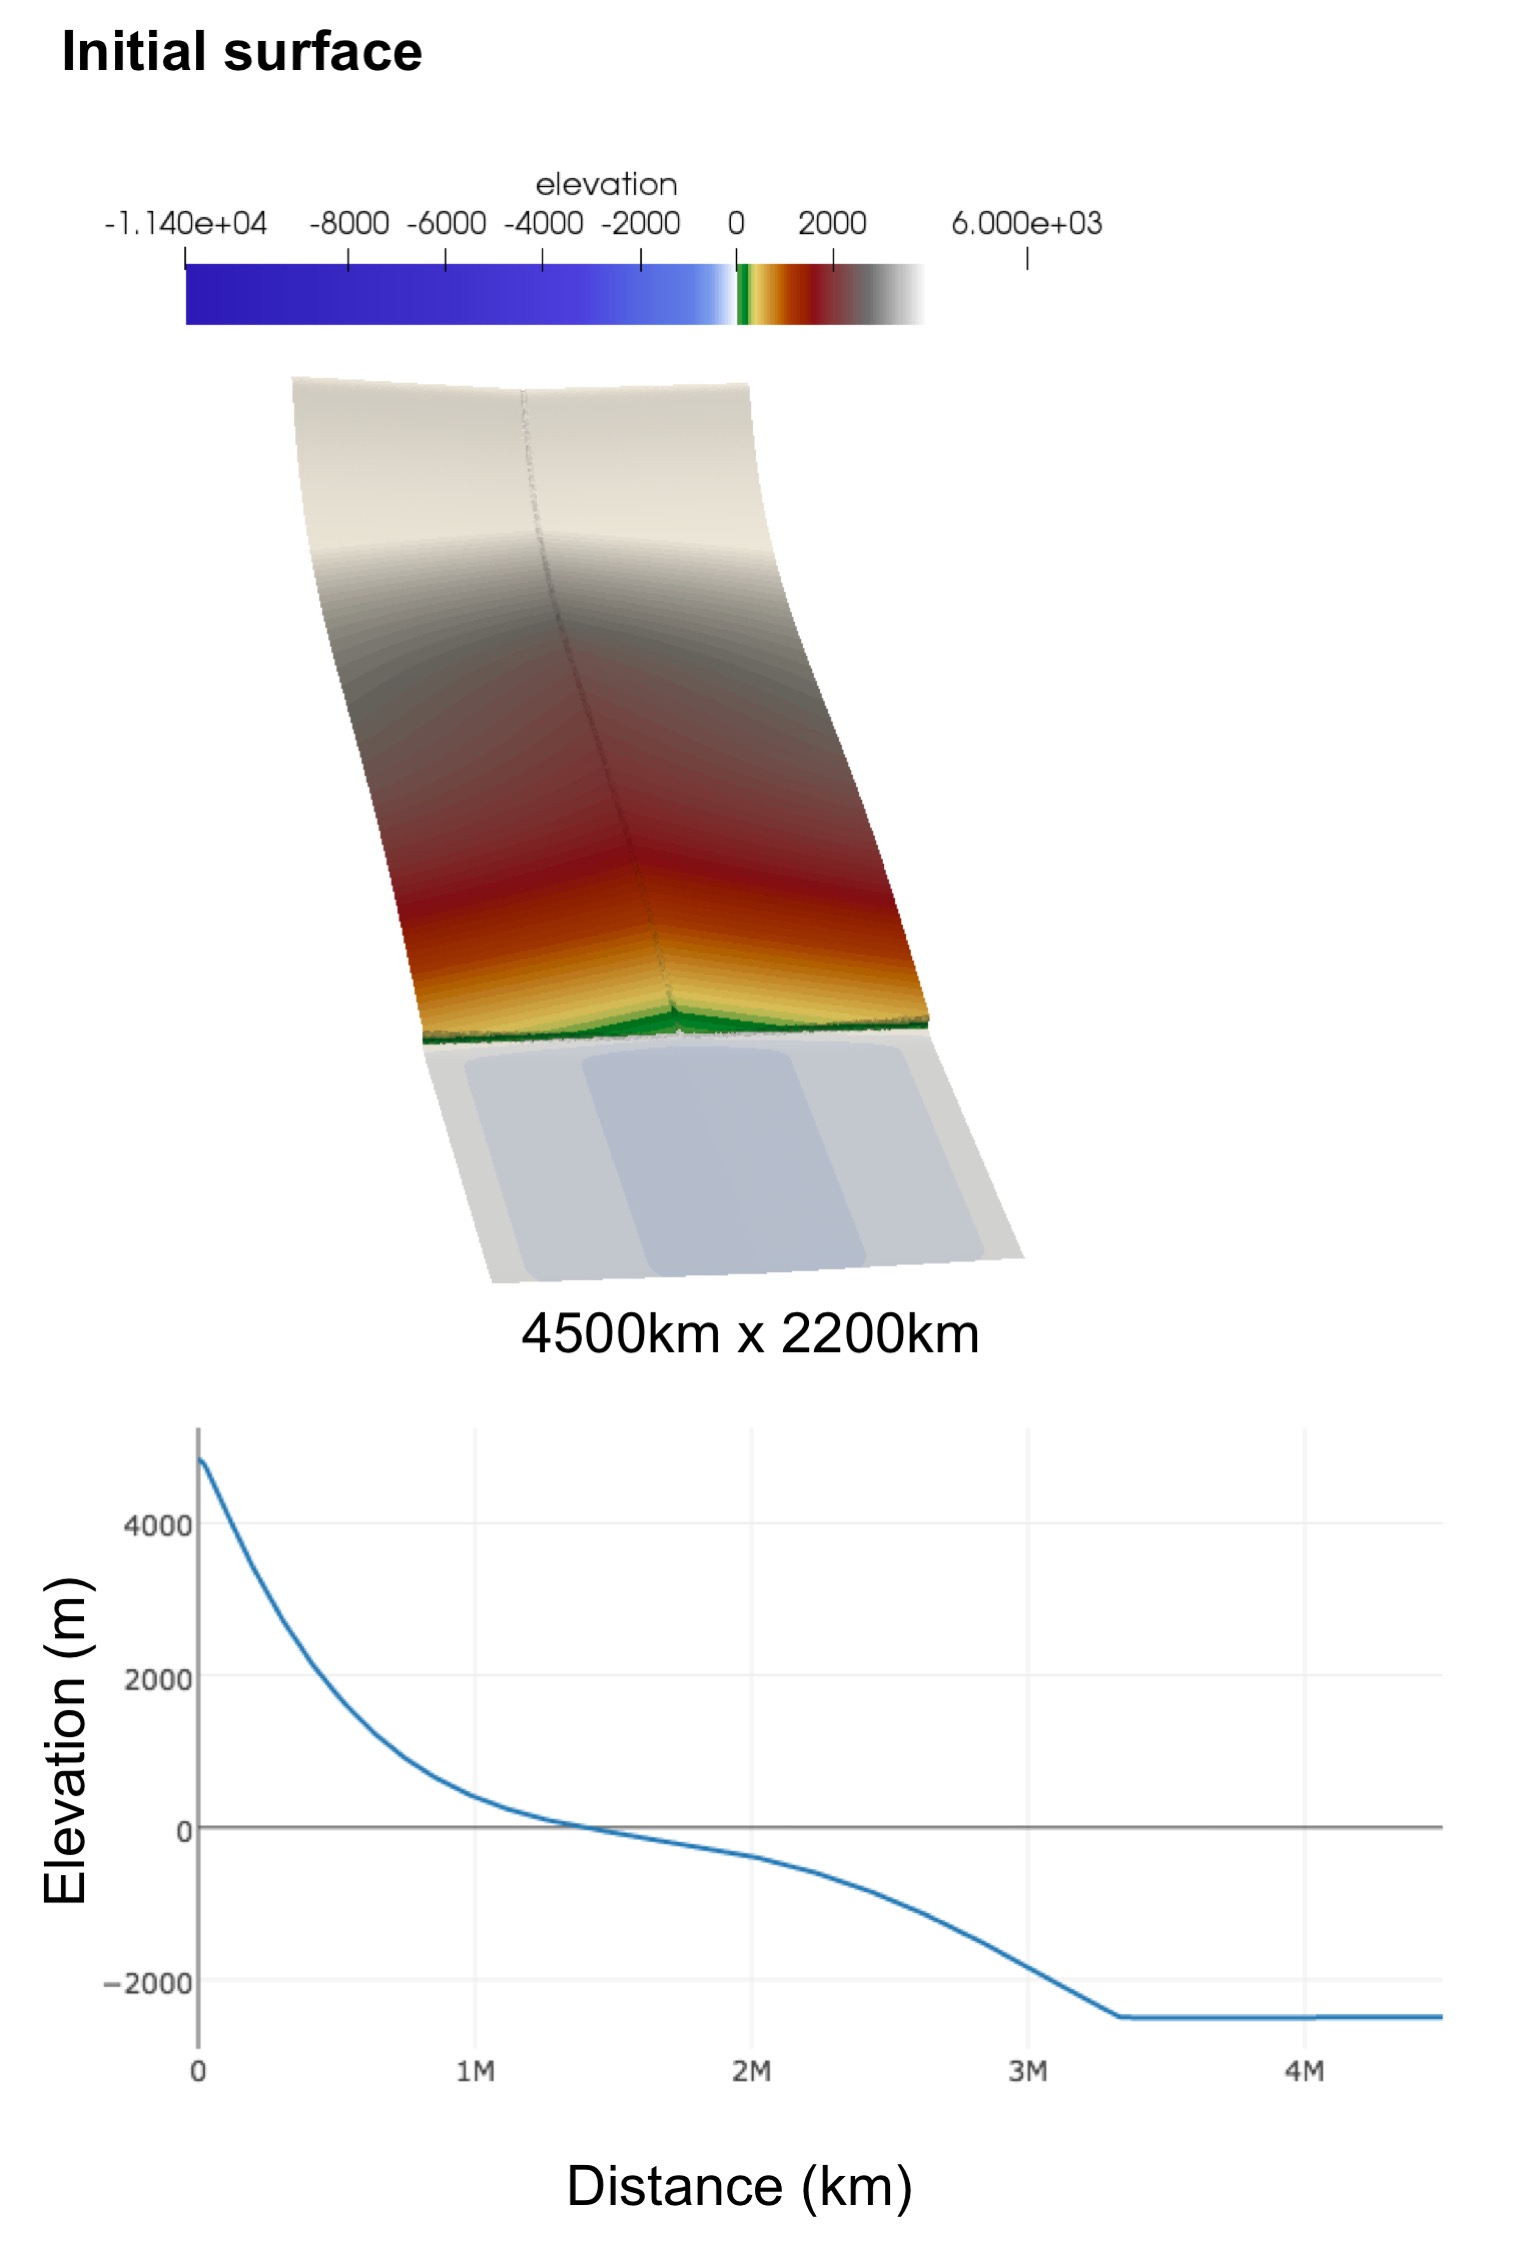 The initial configuration of the modeling domain resembles the topography of a natural source to sink system with relief on the headwaters, a decrease in slope on the continental plain and successive changes on the gradient of the continental shelf and the continental slope. To ensure that our simulations mimic a funnel-like drainage basin shape in the continental domain and sediment is delivered to the marine domain through a point-source we imposed a longitudinal topographic low in the middle of the modeling domain.
Conditions:
| Parameter | value |
|---|---|
| precipitation [m/a] | 1 |
| erodibility coefficient | 4.e-7 |
| diffprop | 0.075 |
| elastic thickness [km] | 50 |
Results:
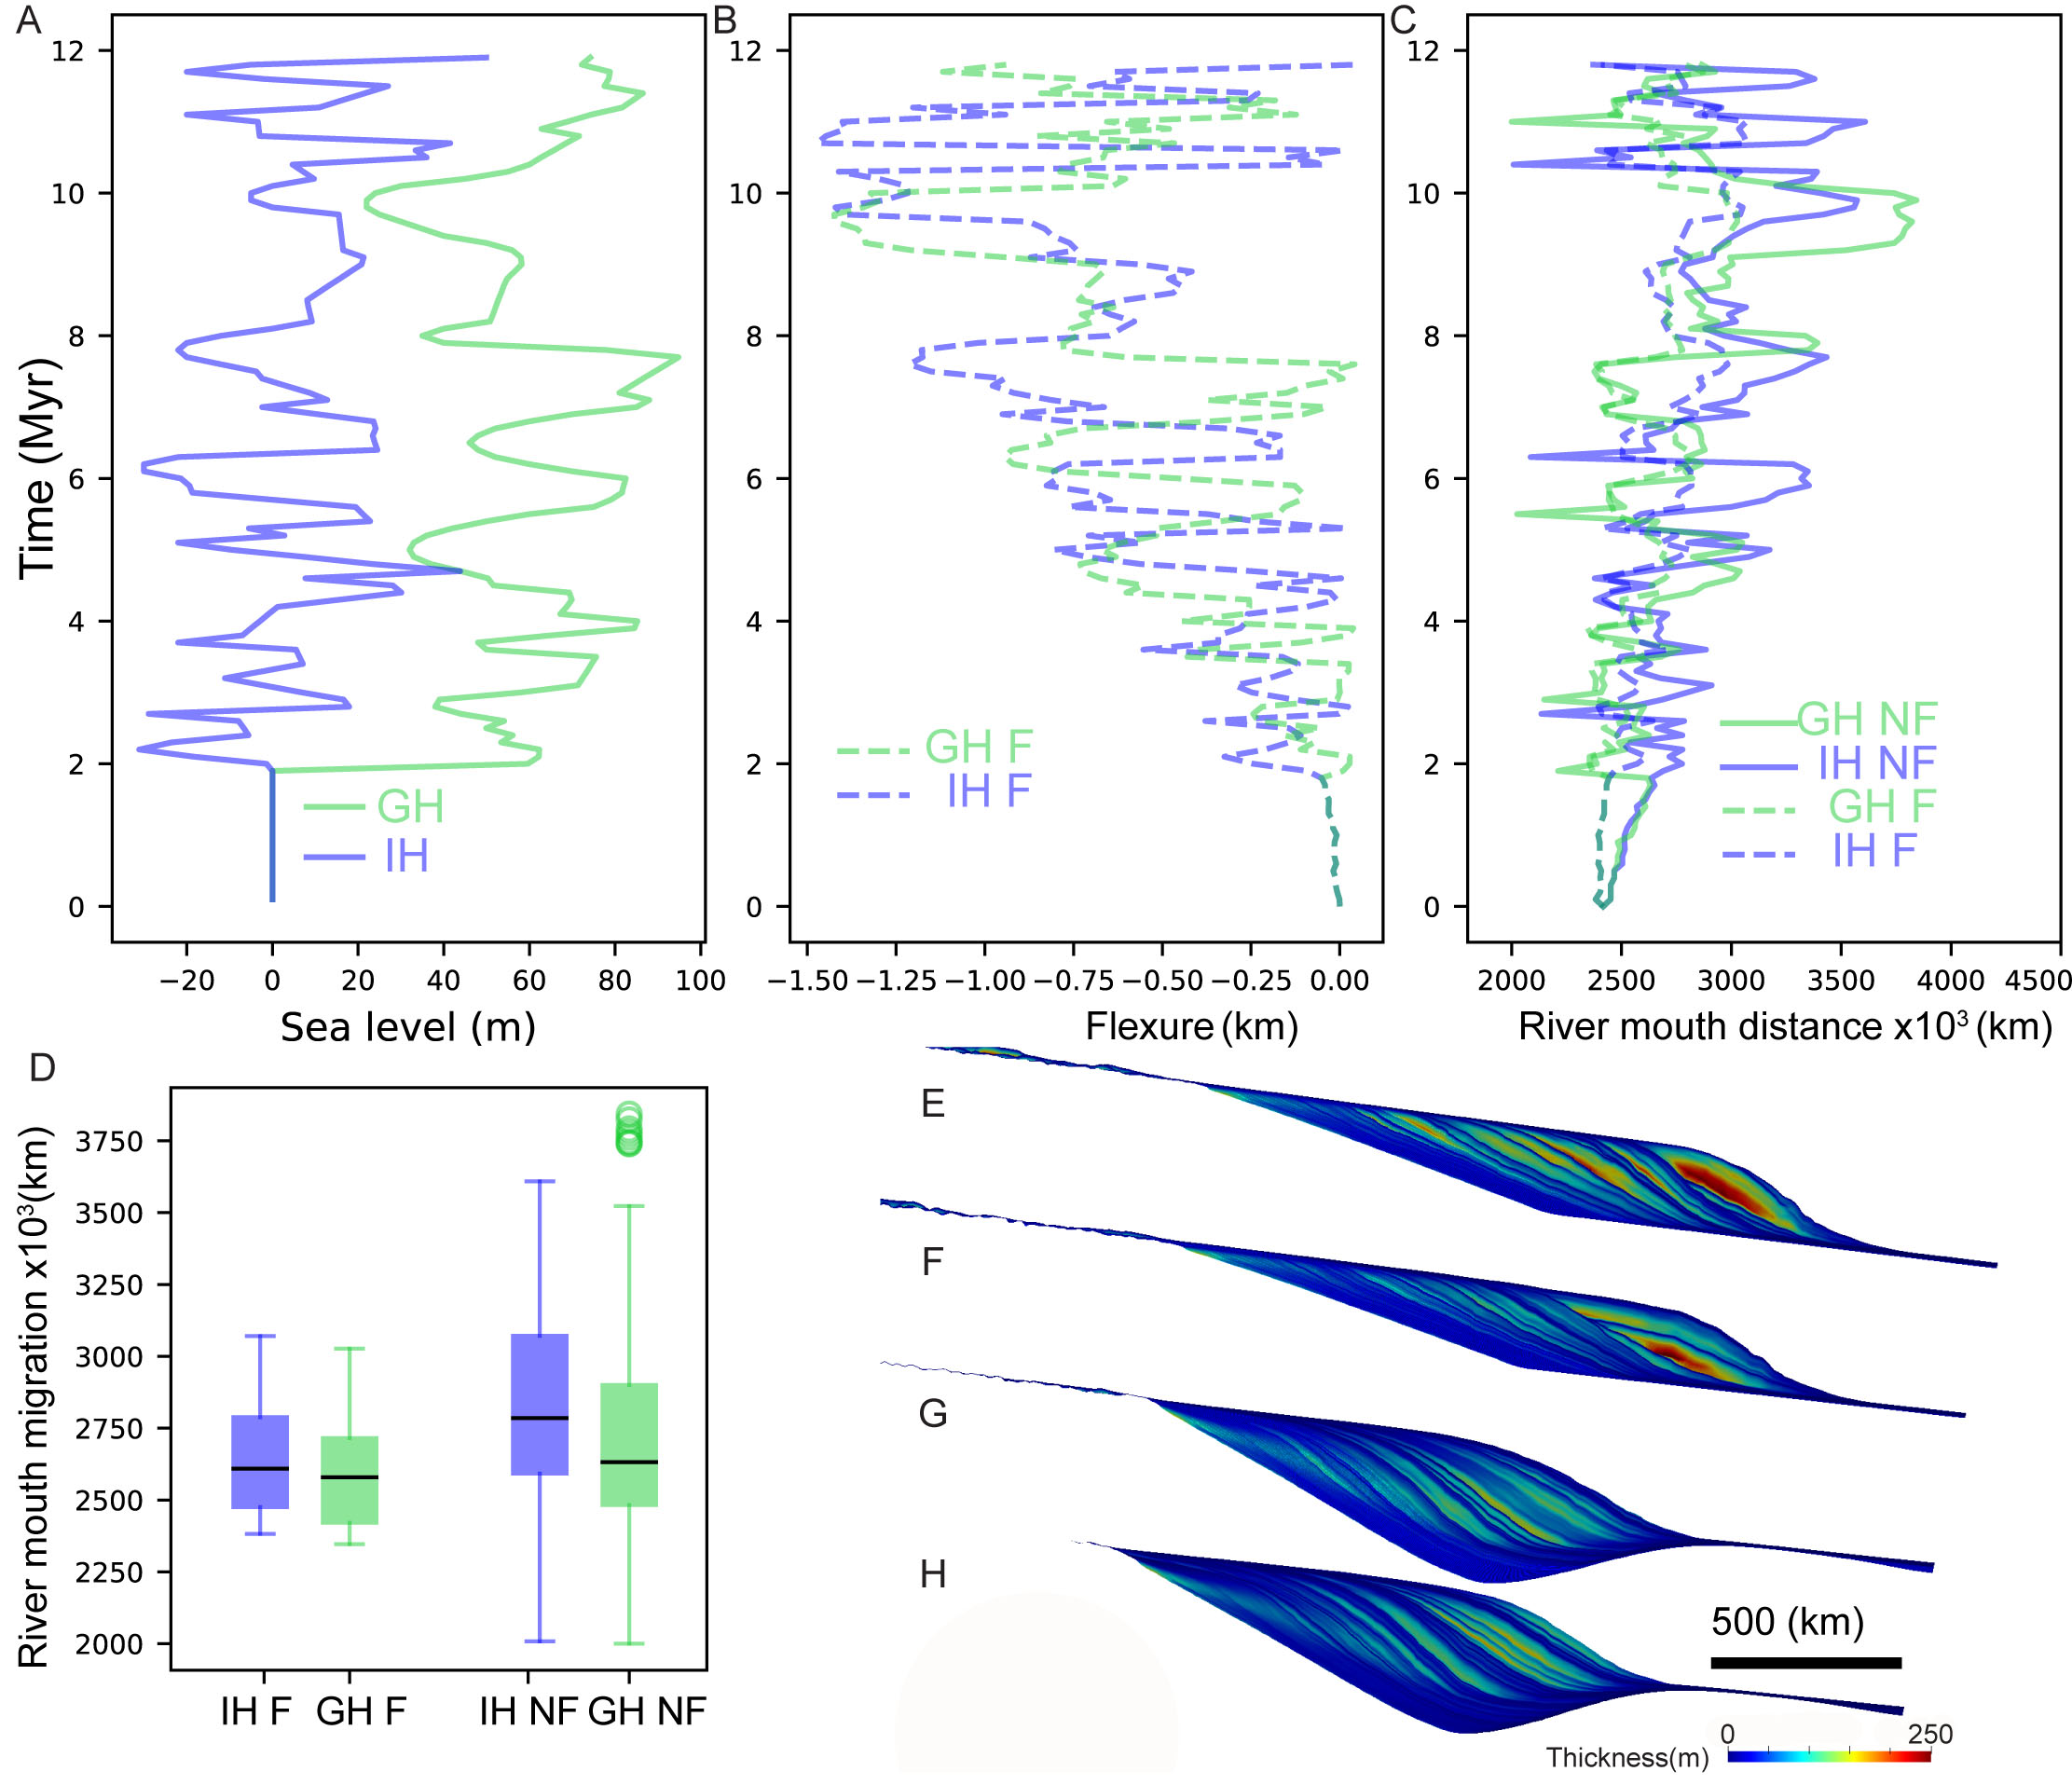 (A) Sea-level curves from the Oligocene (33.9 - 23.9 Ma) and the Paleocene (66.0 - 56.0 Ma), which were used in the simulations to represent contrasting ice house (blue) and green (green) house periods, respectively. Notice the difference in the amplitude between the two curves. The first 2 Myr do not have any sea-level fluctuations so that the delta can reach dynamic equilibrium without any base level disturbances. (B) Computed flexural deflection through time (C) Basinward distance through time, note how transit distances are at least two times larger in the cases with no flexure (D) Boxplots display the 25 and 75 percentiles of the river mouth migration data, the central line in each box represents the median and the bars extending from each box represent the 10 and 90 percentiles for each group of data. IH= Ice House, GH=Green House, F = Flexurally compensated, NF= Non-Flexurally compensated. (E-F) Synthetic stratigraphy extracted from simulations IH F, GH F, IH NF, GH NF expressed as the stratigraphic thickness for each time step (100,000 Myr). Vertical exaggeration is 100.