The evolution of the Great Barrier Reef
Amanda C. Thran , Madison East, Jody M. Webster , Tristan Salles, and Carole Petit
Software Used:
- Badlands 1.0
Model Setup:
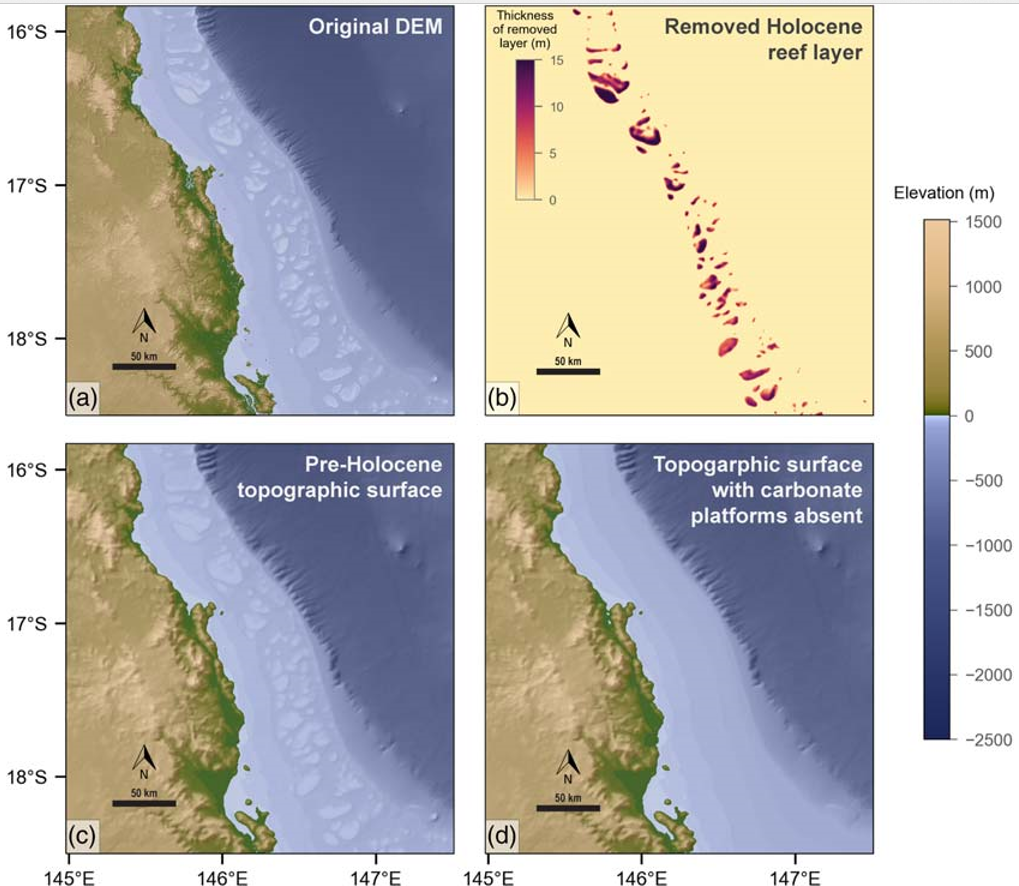 Bathymetry and topography were extracted from a digital elevation model (DEM) spanning the entire Great Barrier Reef margin (3DGBR). This surface was used to construct a “pre-Holocene” surface and a “no platforms” surface. For the “pre-Holocene” surface, Holocene carbonate accretion by reefs is “shaved off” the platforms using a simplifying assumption (15 m total vertical accretion during the Holocene, derived from sediment cores). For the “no platforms” surface, platforms were removed from bathymetry and the continental shelf was smoothed. Subsidence is assumed to be minimal over the course of the simulation.(a) Original DEM spanning the computational domain. (b) Thickness representing the most recent Holocene reef growth on platforms. This layer was removed from the original DEM to produce the pre‐Holocene surface depicted in the next panel. (c) Smoothed pre‐Holocene topographic surface. (d) Artificial surface with carbonate platforms removed entirely.
Conditions:
| Parameter | Value |
|---|---|
| Simulation start time (yrs) | -30000 |
| Simulation end time (yrs) | 0 |
| Maximum time step (yrs) | 100 |
| Critical slope used to force deposition on alluvial plain (m/m) | 0.005 |
| Maximum percentage deposition on alluvial plain | 50% |
| m (from Stream Power Law) | 0.5 |
| n (from Stream Power Law) | 1 |
| Ke (land) | 9E-08 |
| Ke (shelf and marine) | 7.5e-06 |
| Critical density of water+sediment flux to trigger hyperpycnal (kg/m3) | 1000.025 |
| Kd (land; m2/yr) | 0.0008 |
| Kd (shelf and marine; m2/yr) | 0.0001 |
| Kd (landslides; m2/yr) | 0.2 |
| Scaling parameter alpha | 2000 |
| Critical slope to trigger landslide (m/m) | 0.25 |
| Mean grain size diameter (mm; for wave module) | 0.1 |
| Wave sediment diffusion coefficient | 50 |
| Wave sediment entrainment coefficient | 0.5 |
| Maximum wave-induced erosion per time step (m) | 0.2 |
| Maximum wave base (m) | 20 |
| Significant wave height (m) | 2.0 |
| Predominant wave direction | West |
| Maximum vertical accretion rate (shallow coral assemblage) | 1.2 cm/yr |
| Maximum vertical accretion rate (deep coral assemblage) | 1.0 cm/yr |
Results:
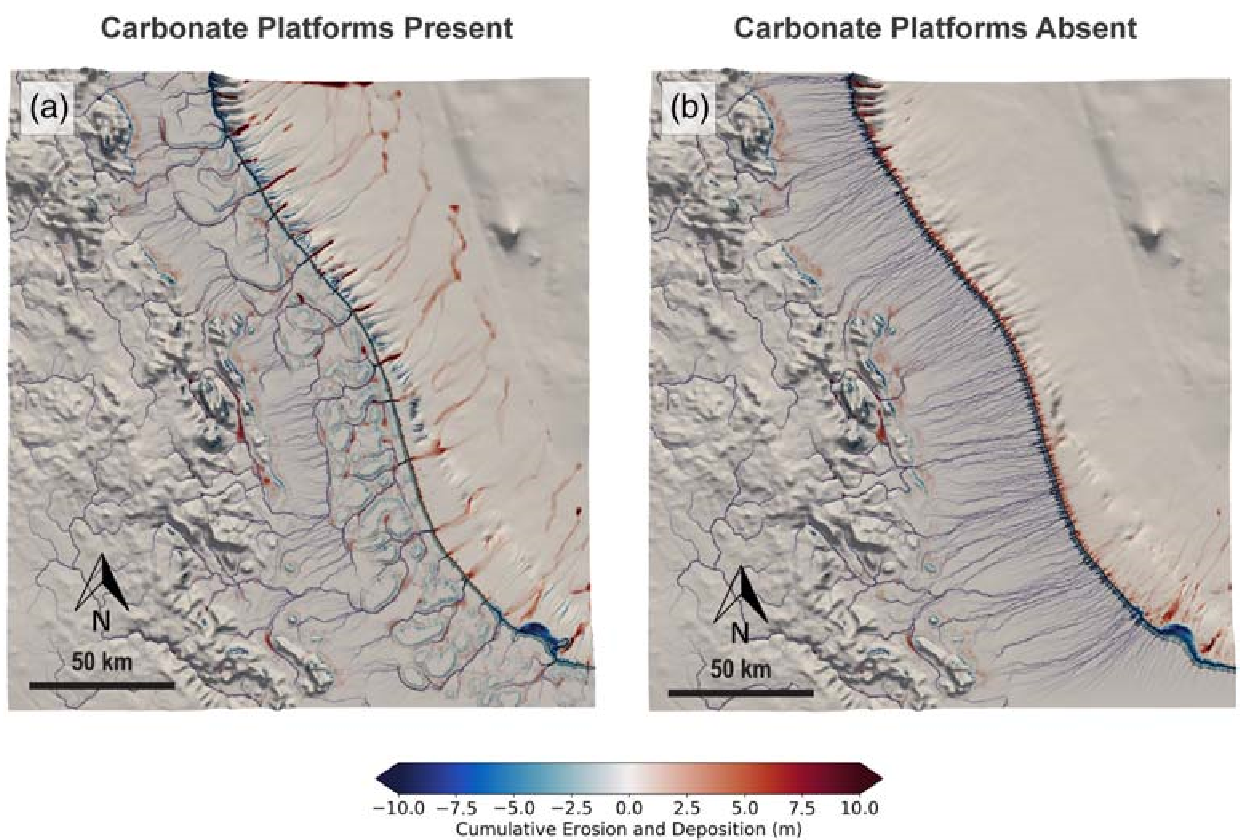 Simulation shows the different configurations of river networks simulated from 30-15 ka (during the last lowstand). When reef platforms are present, rivers are diverted around the platforms and deposit their sediments within inter-platform passages. When reef platforms are removed, sediments are diffusely deposited on the upper continental slope. Drainage network evolution from lowstand (30 ka) to the beginning of the transgression (15 ka) for simulations containing carbonate platform topography (a) and no carbonate platforms (b). Major rivers and streams computed in the model are shown in blue, where drainage patterns at 30, 25, 20, and 15 ka are overlain over cumulative erosion and deposition over this period. Red areas around the carbonate platforms indicate deposition of both platform and fluvial sediments.